
Purpose
Replace blank cells in a chart’s data table to create a continuous plot line
LINKS to related posts
Method — this example replaces blank cells with ‘N/As’ using an IF statement
If you have blank cells in a data table, and want to plot a line chart with a continuous line without any gaps, then you can replace the blanks with ‘N/As’, using an IF statement — see syntax below.
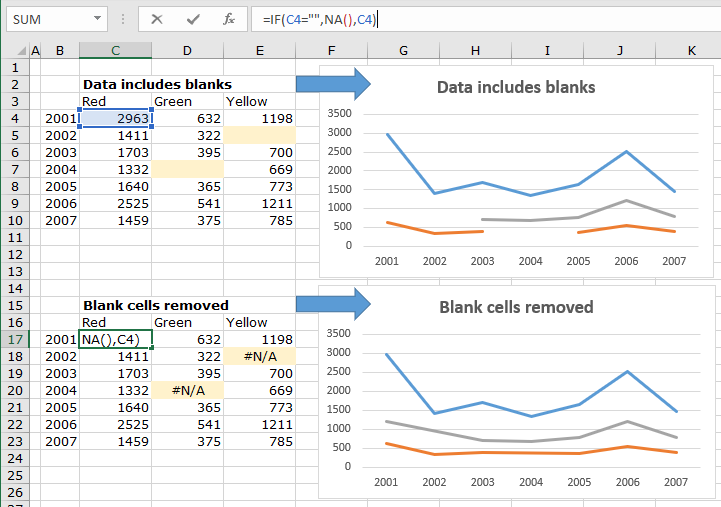
Replicate your data table in another location and replace the blank cells with ‘N/A’ values
- Choose another range of cells to place your data values to plot, either on the same worksheet or a different worksheet. In the example above, a range below the source data table on the worksheet is used.
- Use the IF statement shown in the syntax example below to refer to each value in the source data range.
- Add the IF statement in the cell at the top left corner of your new grid of values, and then drag the right-hand corner of the cell to copy down the rows and across the columns — match the number of rows and columns of your source data table.
- Because the IF statement is using relative cell references, the statement will update automatically to refer to the relevant cell in your source data range.
- You can now plot this new set of data and create continuous plot lines.
Syntax — replace blank cells with ‘N/As’
= IF(C4=””, NA(), C4)
Syntax description
If cell C4 is blank (i.e. contains “”), then return an ‘N/A’ value which means “not available”, or “value is not available, else return the value that is in C4.