
Purpose — to add error bars to an Excel chart using custom data
Links to topics on this page
- What are error bars?
- Error bars in Excel
- Video — plot custom error bar data on an Excel chart
- Calculate custom error bar data to plot on an Excel chart
- Description — plot custom error bar data on an Excel chart
What are error bars?
Error bars show the degree of error or variation in a variable or parameter. They are also referred to as confidence intervals or confidence levels. Error bars plot the range of values for which there is a specified probability that the true value of a parameter lies within that range.
Error bars in Excel
There are standard options to choose from when adding error bars to Excel charts: Standard Error, Percentage, Standard Deviation, or a Fixed Value.
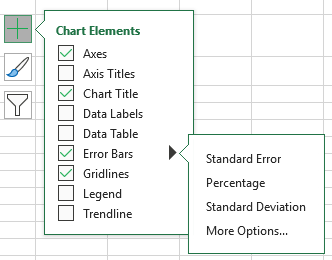
There is also the option to add custom error bar data, by selecting on More Options… from the Error Bars dropdown in the Chart Elements selector.
The custom error bar option is the method shown below.
Method — plot custom error bar or confidence interval data on an Excel chart
Calculate custom error bar data
The key to adding custom error bar or confidence interval data to an Excel chart is to calculate the difference between the upper and lower error values and the series values to be plotted. Include these values in your data table to load into the chart.
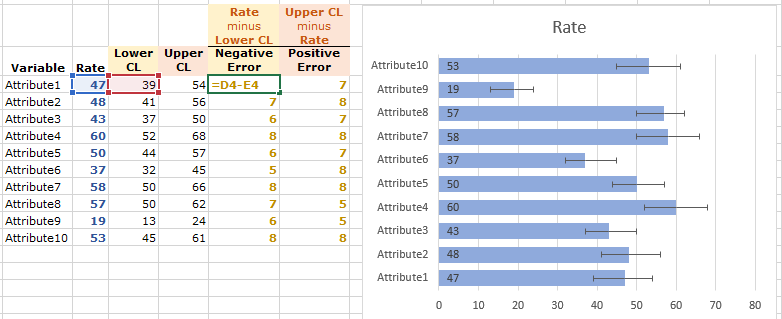
In the data table example below, the data table contains the variable (series) values (Rate), and Lower and Upper confidence levels (CL). The error values to plot in the error bars have been calculated as follows:
- Positive Error Value = Upper CL minus Rate
- Negative Error Value = Rate minus Lower CL.
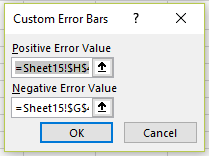
These are the values that are selected into the error values fields in the Custom Error Bars dialog box.
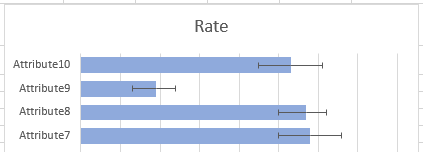
- Excel takes the Positive Error Value and adds it back to the series value to plot the right-hand end of the error bar.
- Excel takes the Negative Error Value and subtracts it from the series value to plot the left-hand end of the error bar.
Add custom error bars to a chart in Excel
- Add the error bar data to your data table for the chart — see calculate error bar data above for more details.
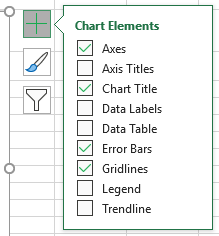
- Select the chart and click on the big plus (+) sign (which appears at the top right hand corner of the chart) to open the Chart Elements options.
- Select Error Bars | More options…
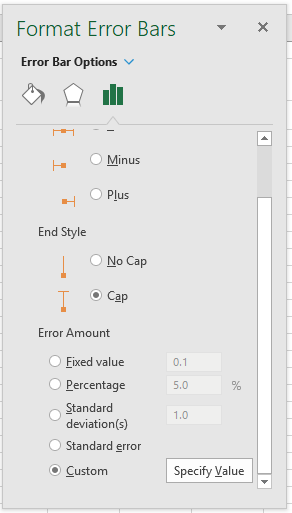
- In the Format Error Bars pane, on the tab with the bars symbol, scroll down to find the ‘Custom‘ radio button, and click in the ‘Specify Value‘ box.
- The Custom Error Bars dialog opens, and you can then select the error values to plot in the error bars. The positive and negative error values go into the separate selection fields.