
Purpose
To easily group and summarize a data table in Excel
Excel includes features on the Data tab | Outline section of the ribbon to group and subtotal data. Grouping the data allows parts of the the data table to be hidden, and to be summarized by various functions such as Sum, Average, and Count.
Method (see video above)
- First lay out your data so that you have category, sub-category, and value columns in a data grid.
- Sort the data by the group column to be sub-totaled. Note: you won’t be able to sort your column values after the data is grouped; but you will be able to sort the sub-totaled values.
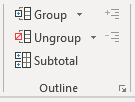
- Highlight the whole set of data, and from the Data tab, select ‘Group‘ from the Outline area.
- Select Rows or Columns, or both, to set up the grouping.
- Click OK.
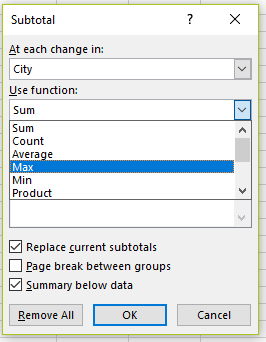
- To summarize the data, with a range, or the whole set of data selected, click on ‘Subtotal‘ in the Outline section of the Data tab. The options are to summarize the rows/columns by Sum, Count, Average, Max, Min, Product.
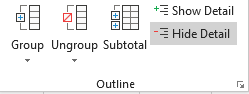
- To hide/unhide parts or all of the grouped data table, select the range of cells as required, and then select Hide Detail / Show Detail from the Outline options.
When you use Excel’s Subtotal feature, the SUBTOTAL() function is inserted. You can use this function manually on columns of data — it can’t be used to subtotal rows. However, using the inbuilt Subtotal feature described above deals with large quantities of data more quickly.
Syntax — Excel’s SUBTOTAL() function
= SUBTOTAL ( function_num, ref1, [ref2], …)
Syntax description
- function_num (required) specifies which summary function to use (see table below); e.g. 1 (average including hidden values), 101 (average ignoring hidden values). Hidden values are those rows hidden by the ‘Hide & Unhide‘ sub-menu of the ‘Format‘ options in the ‘Cells‘ section of the Home tab ribbon.
- ref1 (required) is the range of cells to be sub-totaled.
- [ref2] etc. are optional additional ranges to subtotal.
| Function_num (includes hidden values) | Function_num (ignores hidden values) | Function |
|---|---|---|
| 1 | 101 | AVERAGE |
| 2 | 102 | COUNT |
| 3 | 103 | COUNTA |
| 4 | 104 | MAX |
| 5 | 105 | MIN |
| 6 | 106 | PRODUCT |
| 7 | 107 | STDEV |
| 8 | 108 | STDEVP |
| 9 | 109 | SUM |
| 10 | 110 | VAR |
| 11 | 111 | VARP |