
A simple example of a map created in R, using the Shiny and Leaflet packages.
The code below:
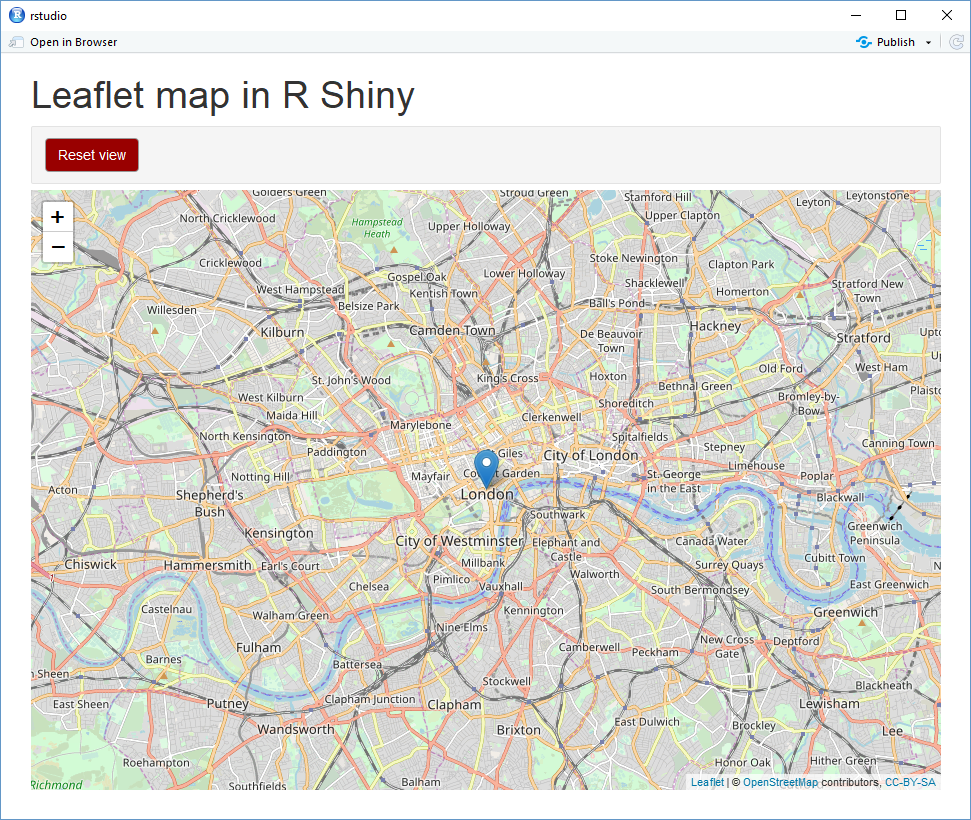
- loads a base map which the user can scroll and zoom
- sets an initial location center and zoom
- adds a placemarker with an information popup when the marker is clicked
- a reset button returns the map to the original view.
See links below for:
- Code without comments
- Image of the map
- References for the code (list of functions used)
- Code with comments
- Links to package resources.
Prerequisites
- R and RStudio;
- R Packages Shiny, Leaflet
Instructions
- Copy the code below and paste into a new file in RStudio;
- Save as an R Markdown file (extension .rmd);
- Install packages Shiny and Leaflet if not already installed; and
- Run in R Studio. The markdown file produces an html document which can be loaded into a browser.
Code without comments (see code with comments below)
---
title: "Leaflet map in R Shiny"
runtime: shiny
output: html_document
---

```{r setup, include=FALSE}
knitr::opts_chunk$set(echo = FALSE)

library(shiny)
library(leaflet)

```

```{r map}

inputPanel(actionButton
(inputId="resetMap",
	label="Reset view",
	style="color: #fff; background-color: #990000; border-style: solid; border-color: #999999; margin: 5px")
	 )

leafletOutput("londonMap",
	height=600,
	width="100%")


output$londonMap <- renderLeaflet({
theMap <- leaflet(options = leafletOptions(zoomSnap=0.1)) %>%
addTiles() %>%
setView(lng=-0.128034, lat=51.508047, zoom = 12) %>%
addMarkers(lng=-0.128034, lat=51.508047,popup="Trafalgar Square, London")
})

observeEvent(input$resetMap,
	{leafletProxy("londonMap") %>%
setView(lng=-0.128034, lat=51.508047, zoom = 12)
})


```References for the code – see also code with comments below
Functions in Shiny
- inputPanel() | a style wrapper for input controls or other HTML elements https://shiny.rstudio.com/reference/shiny/0.11.1/inputPanel.html
- actionButton() |
https://shiny.rstudio.com/reference/shiny/latest/actionButton.html - leafletOutput() | https://www.rdocumentation.org/packages/leaflet/versions/2.0.2/topics/leafletOutput
- output$[object] | calling an output object created elsewhere in the code, e.g. a map, text object, plot
- renderLeaflet() | https://rstudio.github.io/leaflet/shiny.html
- observeEvent() | https://shiny.rstudio.com/reference/shiny/1.0.0/observeEvent.html
Functions in Leaflet
- leaflet() and leafletOptions() | main functions to call and customise the map, https://rstudio.github.io/leaflet/map_widget.html
- addTiles() | adds the base map, https://rstudio.github.io/leaflet/basemaps.html
- setView() | sets the initial view, https://rstudio.github.io/leaflet/map_widget.html
- leafletProxy() | to control a map that has already been rendered, https://www.rdocumentation.org/packages/leaflet/versions/2.0.2/topics/leafletProxy
- zoomSnap= | enables the zoom to be set to within 0.1 rather than integer jumps, https://leafletjs.com/reference-1.4.0.html
Functions in base R and R markdown
- title, runtime, output | YAML metadata, https://bookdown.org/yihui/rmarkdown/html-document.html
- r code chunk delimiters | https://bookdown.org/yihui/rmarkdown/r-code.html
- knitr options | https://yihui.name/knitr/options
- The pipe operator (%>%) | https://cran.r-project.org/web/packages/magrittr/vignettes/magrittr.html
Custom variables
These are the custom variables used in the code which you can replace with your own names:
- resetMap (id for the action button)
- londonMap (name for the ‘reactive’ map output)
- theMap (name for the actual map).
Code with comments
---
title: "Leaflet map in R Shiny"
runtime: shiny
output: html_document
---

```{r setup, include=FALSE} #include=TRUE would include the
knitr::opts_chunk$set(echo = FALSE)

library(shiny)
library(leaflet)

```

```{r map}
# create the button to reset the map view
inputPanel(actionButton
(inputId="resetMap",
	label="Reset view",
	style="color: #fff; background-color: #990000; border-style: solid; border-color: #999999; margin: 5px")
	 )
# display the map
leafletOutput("londonMap",
	height=600,
	width="100%")

# create the output which will be displayed in the page in the 'leafletOutput' function above
output$londonMap <- renderLeaflet({
theMap <- leaflet(options = leafletOptions(zoomSnap=0.1)) %>%
addTiles() %>%
setView(lng=-0.128034, lat=51.508047, zoom = 12) %>%
addMarkers(lng=-0.128034, lat=51.508047,popup="Trafalgar Square, London")
})

# the event which goes with the actionButton above (id name is 'resetMap')
# when the button is clicked, the map will return to the original center and zoom
observeEvent(input$resetMap,
	{leafletProxy("londonMap") %>%
setView(lng=-0.128034, lat=51.508047, zoom = 12)
})


```
Links to resources
- Shiny
- Leaflet for R
- Getting latitude and longitude values for locations:
- Use google maps. Click on a place, right-click until a marker appears. The latitude and longitude values will be displayed and can be copied. | https://support.google.com/maps/answer/18539
- Use a website such as https://www.latlong.net/.